Navigating and Using Your Reporting Dashboard: A 101 Guide
Your Dashboard is an overview of your business. This is the first thing that you will see when you log into . It will outline the progress and performance of your business. Here are the potential different parts of your default Dashboard:
Overview
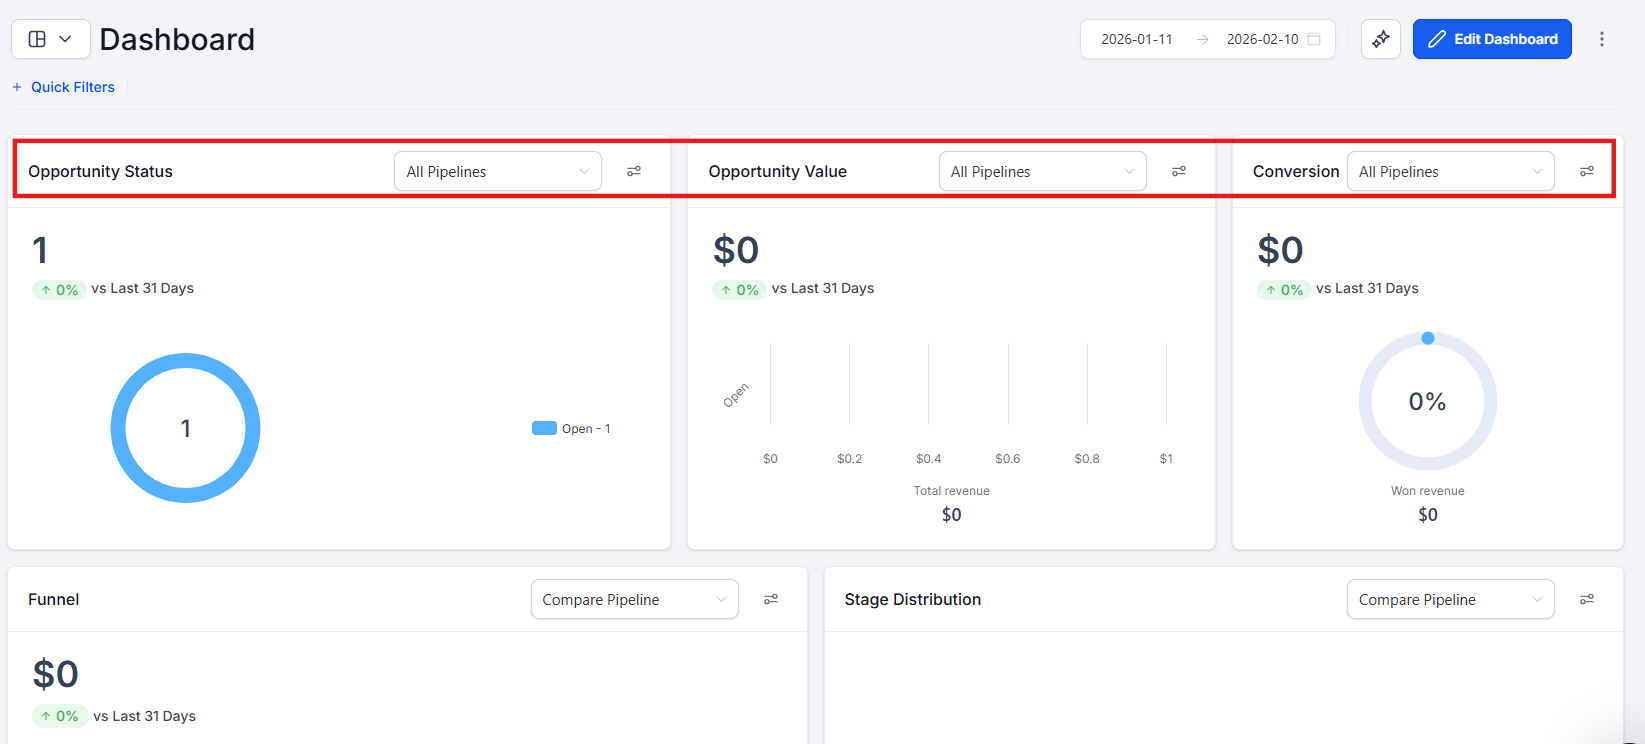
Section titled “Overview”Row 1:
Section titled “Row 1:”- Opportunity Status: Status of Leads in your Pipeline
- Opportunity Value: All your leads’ total worth
- Conversion Rate: Percentage of your ‘WON’ leads/accounts
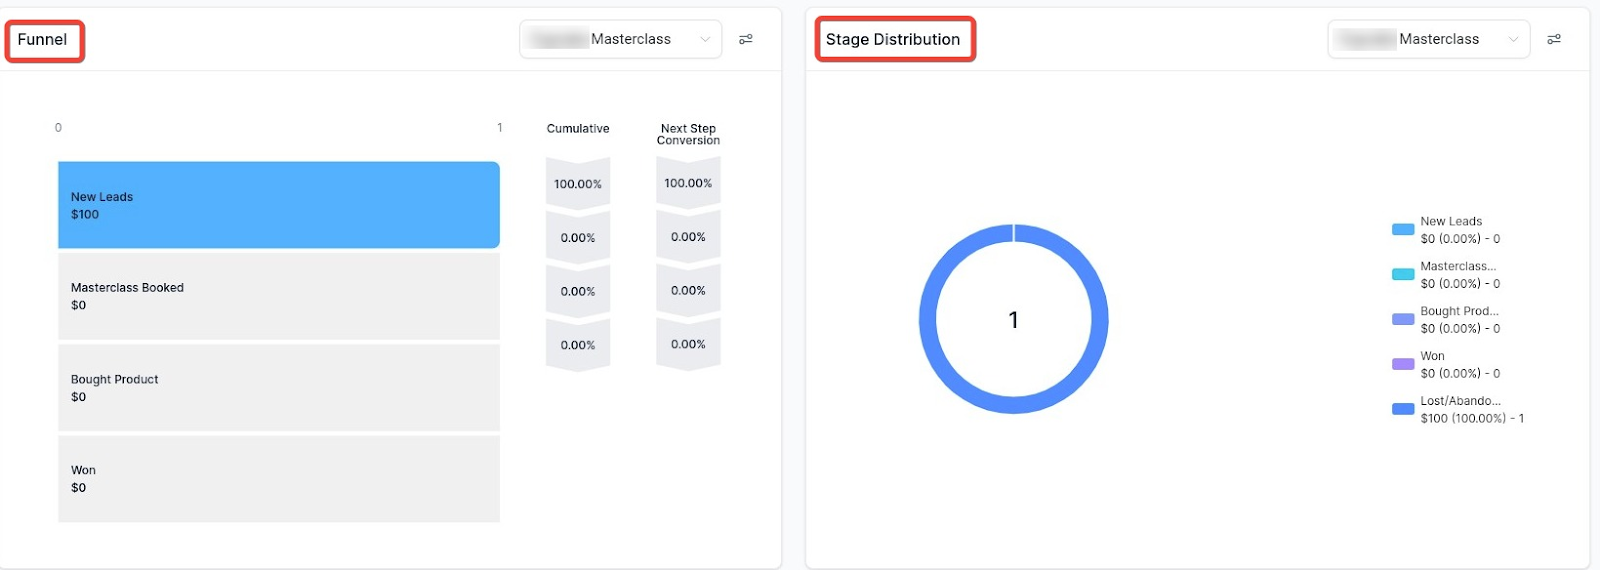
Row 2:
Section titled “Row 2:”- Funnel: A visual representation of what stages your opportunities are within your Pipeline. This is a cumulative data of your opportunities.
- Stages Distribution: This is a cycle graph of your Pipeline
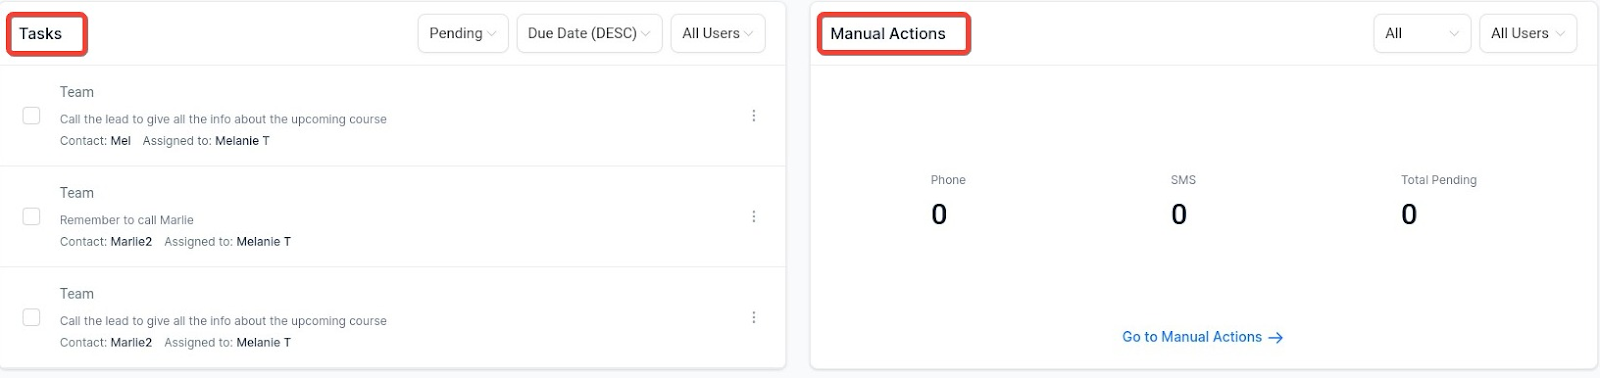
Row 3:
Section titled “Row 3:”- Manual Actions: An overview of manual actions
- Tasks: A list of assigned tasks for one or all users within your account
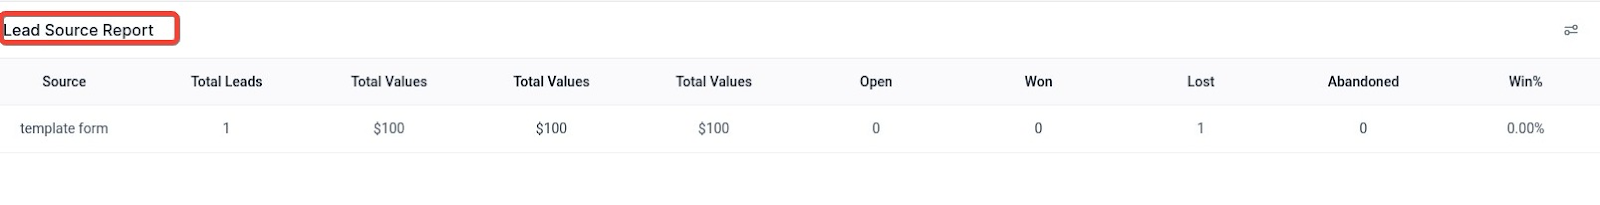
Row 4:
Section titled “Row 4:”- Lead Source Report: Here, you can see where your leads came from and their values
Row 5:
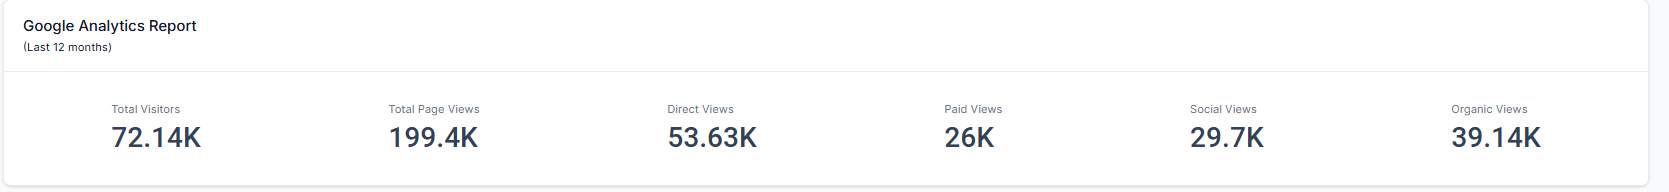
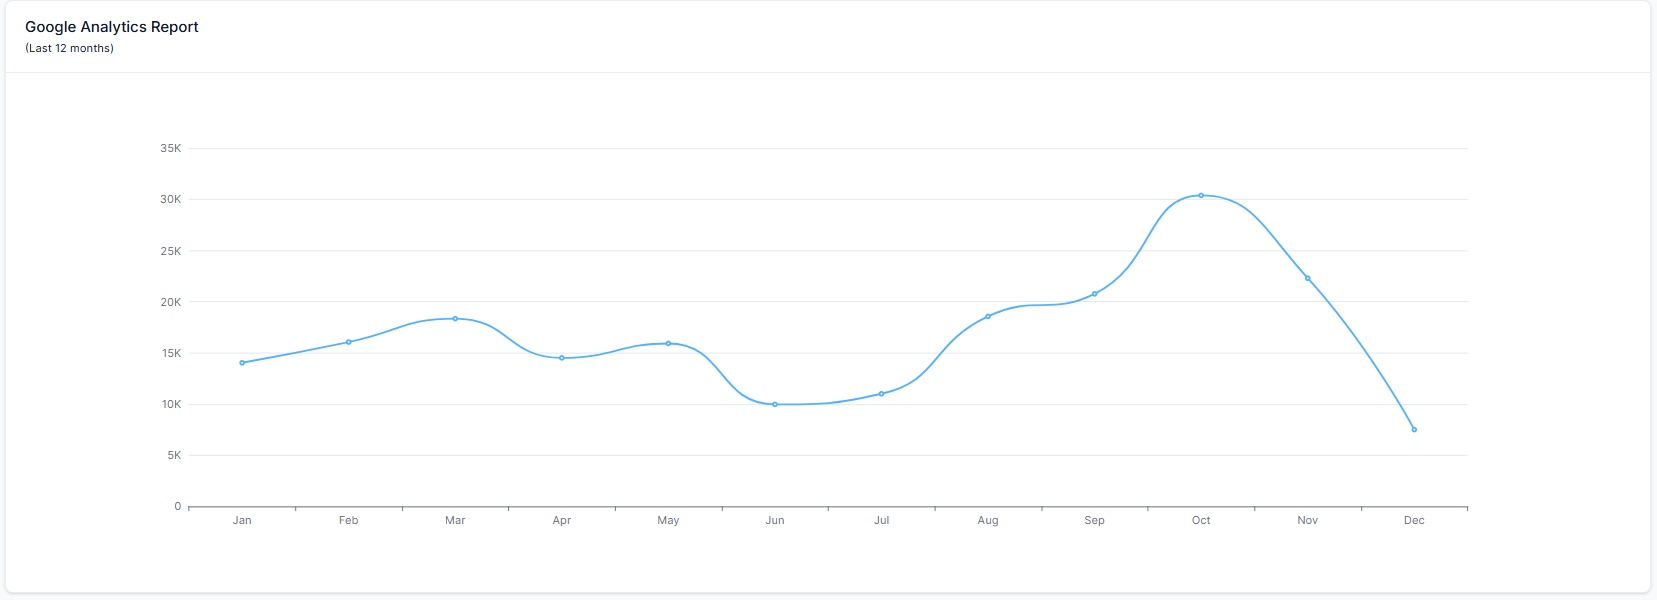
Section titled “ Row 5:”- Google Analytics Report: This section provides insights into your website’s traffic and user behavior. It explains key metrics such as traffic sources, user engagement, and how visitors interact with your site. By understanding these metrics, you can optimize your online presence and enhance user experience
Row 6:
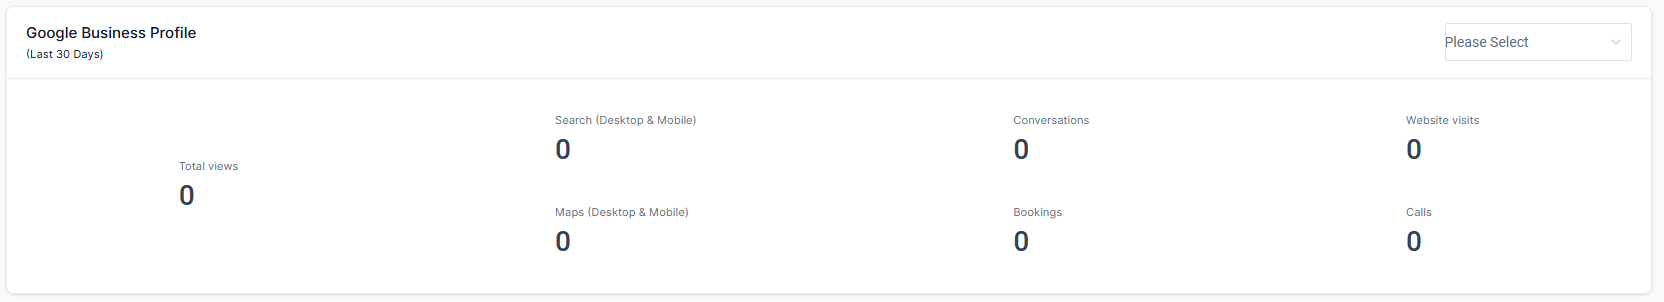
Section titled “ Row 6:”- Google Business Profile (Last 30 Days): This report explains the performance of your business profile on Google over the last 30 days. It includes metrics on how often your profile was viewed, how users found you (via search or maps), the level of engagement (conversations and bookings), and the number of calls or website visits generated from the profile. These insights help track the visibility and impact of your business in local searches.
Row 7:
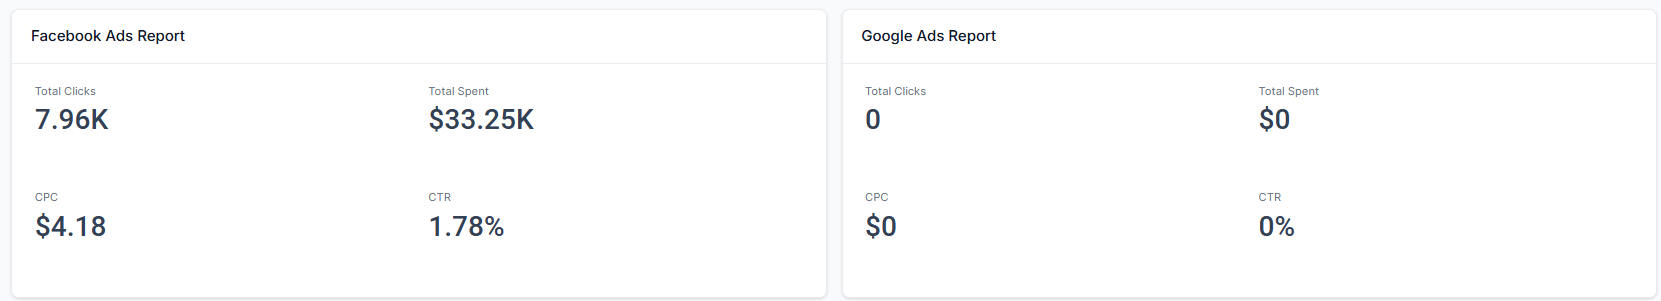
Section titled “ Row 7:”- Facebook Ads Report: This report shows the performance of your Facebook ad campaigns. It explains metrics such as total clicks (how many times your ads were clicked), total spend (how much was spent on ads), cost per click (CPC), and click-through rate (CTR). These metrics help evaluate the effectiveness and return on investment (ROI) of your Facebook ads.
- Google Ads Report: This report provides insights into the performance of your Google Ads campaigns. It covers total clicks (how many times your ads were clicked), total spend (how much was spent on ads), cost per click (CPC), and click-through rate (CTR). This helps you assess the effectiveness of your Google advertising efforts and optimize your ad spend.
Dashboard Summary AI
Section titled “Dashboard Summary AI”The Dashboard Summary AI feature transforms traditional dashboards into intelligent, insight-driven tools that go beyond displaying numbers. By analyzing key metrics and trends automatically, it helps users identify growth opportunities, detect potential risks, and make informed decisions in real time.
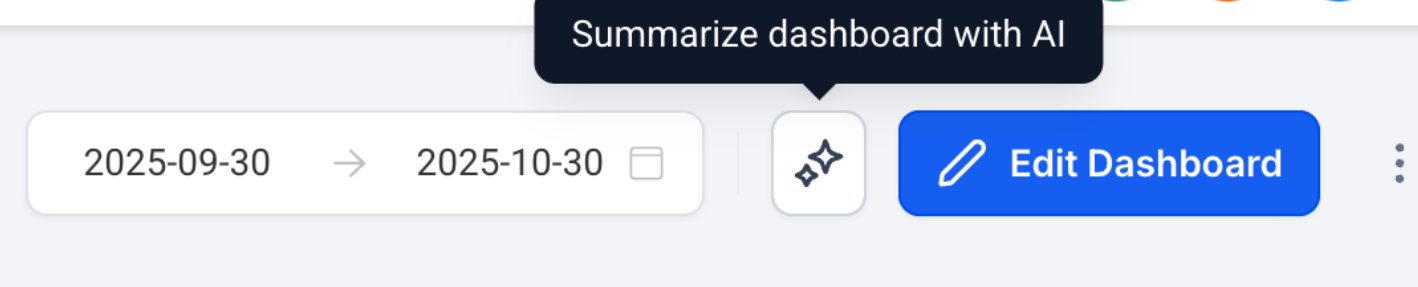
**How to Use:**Click the “Summarize Dashboard with AI” button at the top of your dashboard to generate an instant summary.
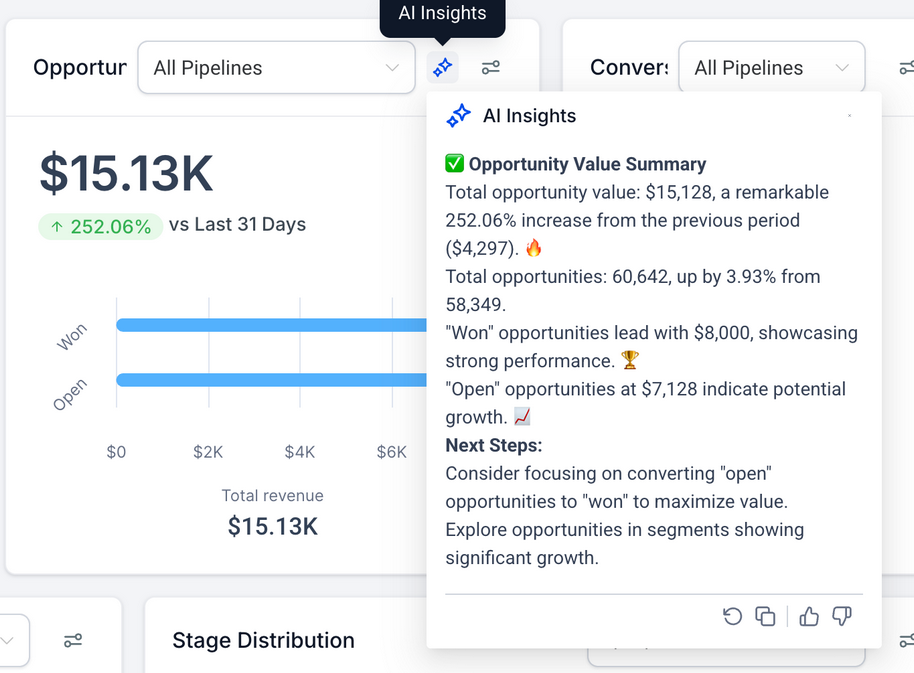
You can also move your cursor over any widget to view AI-powered insights specific to that section. Ensure that the AI Employee option is enabled to access summaries, widget insights, and conversation history.
Question: What is the Dashboard in ? Answer: The Dashboard is an overview of your business’s progress and performance, providing key insights into various aspects of your operations. It is the first screen you see upon logging into and includes metrics and visual representations of your business activities.
Question: What information is displayed in Row 1 of the Dashboard? Answer: Row 1 of the Dashboard displays:
Opportunity Status: Shows the status of leads in your Pipeline.
Opportunity Value: Represents the total worth of all your leads.
Conversion Rate: Indicates the percentage of leads or accounts that have been marked as ‘WON’.
Question: What does the Funnel in Row 2 represent? Answer: The Funnel in Row 2 is a visual representation of the stages your opportunities are currently in within your Pipeline. It helps you understand the flow and progress of leads through different stages of your sales process.
Question: What is shown in the Stages Distribution in Row 2? Answer: The Stages Distribution is a cycle graph that illustrates the distribution of opportunities across various stages within your Pipeline. It provides a quick snapshot of where most of your leads are in the sales process.
Question: What can I find in Row 3 of the Dashboard? Answer: Row 3 provides an overview of:
Manual Actions: Displays an overview of manual actions that need to be taken.
Tasks: Lists assigned tasks for one or all users within your account, helping to track responsibilities and pending actions.
Question: What does the Lead Source Report in Row 4 show? Answer: The Lead Source Report in Row 4 shows the origins of your leads, including the channels they came from and their respective values. This helps you understand which sources are most effective in generating valuable leads for your business.
Question: What is the Google Analytics Report in Row 5? Answer: The Google Analytics Report in Row 5 provides insights into your website’s traffic and user behavior. It tracks key metrics such as traffic sources, user engagement, and page performance to help you optimize your online presence.
Question: What is shown in the Google Business Profile section in Row 6? Answer: The Google Business Profile section in Row 6 explains how your business has been performing on Google, including how often your profile was viewed, how users found you (via search or maps), and the level of engagement with your profile in terms of bookings, conversations, calls, and website visits.
Question: What does the Facebook Ads Report in Row 7 show? Answer: The Facebook Ads Report in Row 7 explains the performance of your Facebook ad campaigns, including total clicks, total spend, cost per click (CPC), and click-through rate (CTR). These metrics help measure the effectiveness of your ad campaigns.
Question: What does the Google Ads Report in Row 7 show? Answer: The Google Ads Report in Row 7 explains the performance of your Google Ads campaigns, including total clicks, total spend, cost per click (CPC), and click-through rate (CTR). These metrics help assess the success of your Google advertising efforts.
Question: How can the Opportunity Status metric help my business? Answer: The Opportunity Status metric provides a clear view of where each lead is in your sales pipeline, allowing you to prioritize follow-ups, track progress, and focus efforts on converting leads that are in critical stages.
Question: Why is the Opportunity Value important on the Dashboard? Answer: The Opportunity Value metric shows the total worth of all your leads, giving you an insight into the potential revenue your pipeline represents. This helps you assess the financial impact of your leads and prioritize high-value opportunities.
Question: How is the Conversion Rate calculated on the Dashboard? Answer: The Conversion Rate is calculated as the percentage of leads or accounts that have been successfully converted to ‘WON’ status compared to the total number of leads. This metric helps measure the effectiveness of your sales process.
Question: Can I customize the tasks shown in the Dashboard? Answer: Yes, the Tasks section in Row 3 lists tasks assigned to users within your account. You can filter or view tasks for specific users or for all users, allowing you to manage and monitor the progress of assigned activities.
Question: Why doesn’t the Funnel data align with the Opportunities tab? Answer: The data for opportunities visible under the Funnel is cumulative. This means it includes opportunities at all stages. For example, if an opportunity progresses through the first, second, and third stages, it will be counted in each of those stages.
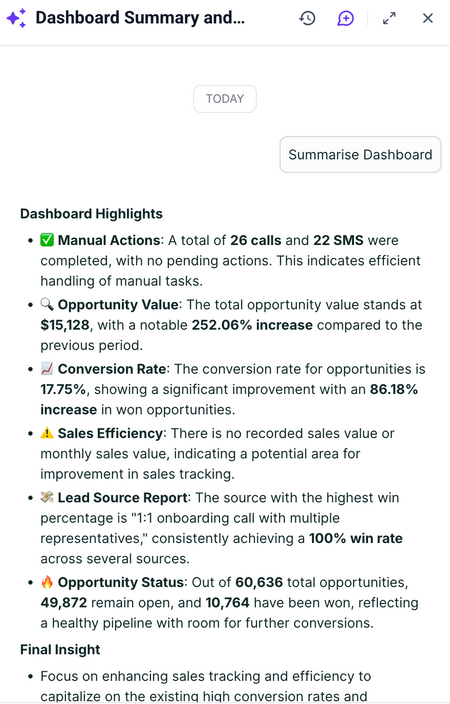
Question: How do I use the Dashboard Summary AI feature? Answer: The Dashboard Summary AI feature automatically analyzes key metrics and trends in your Dashboard, helping you identify growth opportunities, potential risks, and make data-driven decisions. To use it, click the “Summarize Dashboard with AI” button at the top of your Dashboard for an instant summary. You can also hover your cursor over any widget to view AI-powered insights specific to that section.
Question: What must be enabled to access AI-powered summaries and widget insights?
Answer: To access these features, you must ensure that the AI Employee option is enabled. Once active, you will be able to view dashboard summaries, specific widget insights, and conversation history.
Question: How can I quickly add specific report metrics to my main dashboard while browsing different sections of the app? Answer: You can use the Quick Widget Addition feature. While visiting a specific page, click the widget icon at the top of the screen; a pop-up will suggest useful widgets related to that area, allowing you to quickly select and add them to your dashboard.
Question: How can I view AI-powered insights for a specific individual widget on my Dashboard?
Answer: To view insights for a specific section, simply move your cursor over any widget. If the AI Employee option is enabled, the AI will provide specific insights and analysis relevant to that particular widget.