How to Use Call Tracking Widgets in Dashboard
How to use call tracking widgets in Dashboard
Overview: Call tracking widgets in provide a visual way to analyze your telecommunication data. These tools allow you to monitor incoming and outgoing call statuses, track how long your team spends on the phone, and identify trends that can improve your operational efficiency.
Practical Use Case: A service-based business can set up a “Sales Performance Dashboard” to see which team members have the longest average call duration. This helps the owner identify which sales reps are engaging deeply with leads versus those who may need more training on building rapport.
Instructions: Setting Up a Call Tracking Dashboard
Section titled “Instructions: Setting Up a Call Tracking Dashboard”Creating a New Dashboard
Section titled “Creating a New Dashboard”- To start, navigate to the Dashboard section from the main menu.
- To begin the setup, click the button to create a New Dashboard.
.png)
3. To define the purpose of your data, enter a name (e.g., “Call Performance”).
4. To determine your starting point, choose one of these three options:
Create a Blank Dashboard: Start with a clean slate for full customization. From Template Library: Use a pre-made layout to save time. Clone Existing Dashboard: Duplicate a dashboard you have already built.
.png)
.png)
5. To control access, select your Privacy Settings to make the dashboard either “Private” or “Accessible to Everyone.”
6.To finalize the setup, click Confirm.
Adding and Configuring Call Widgets
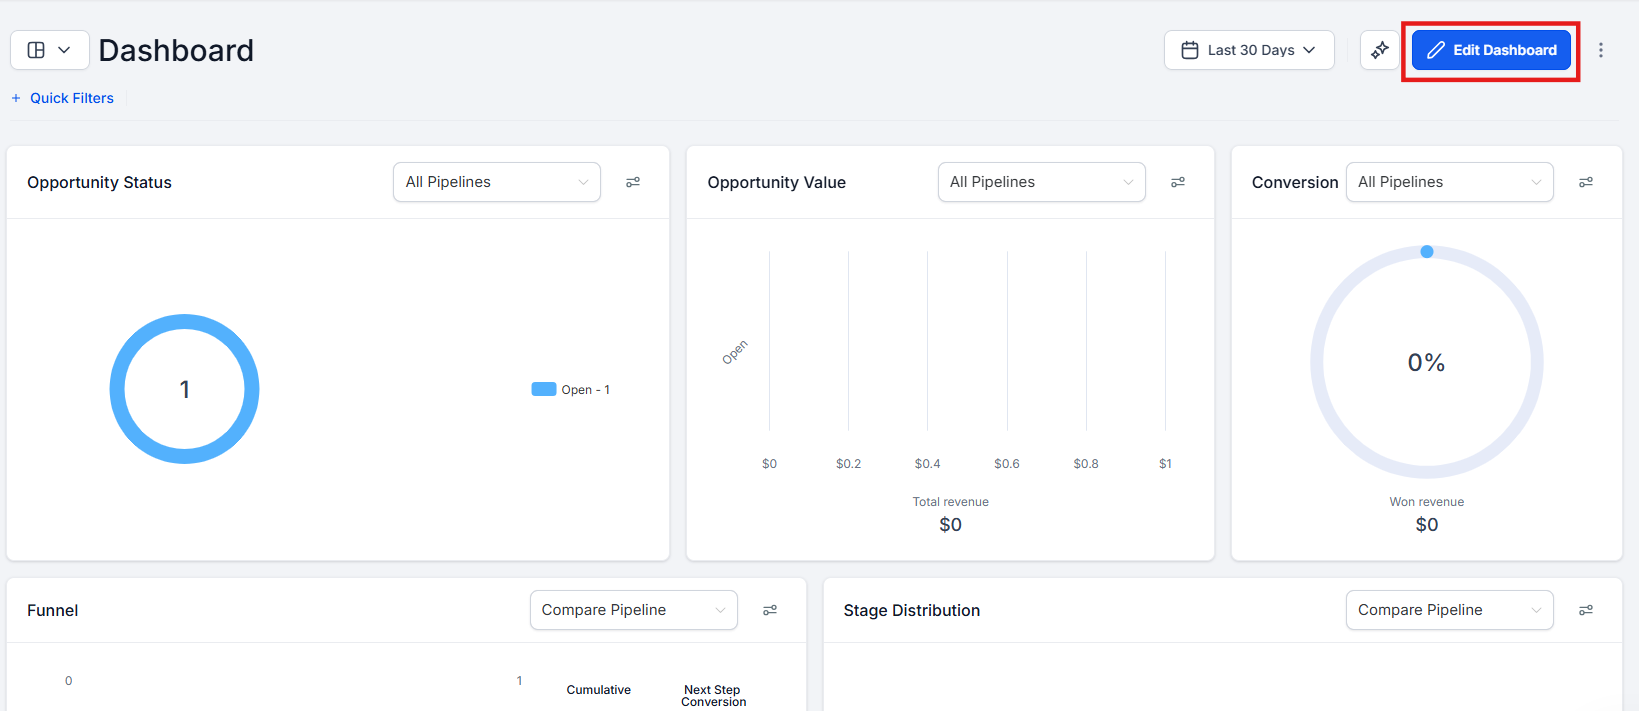
Section titled “Adding and Configuring Call Widgets”- To enter customization mode, click the Pencil Icon or the Edit Dashboard button.
2. To view available tools, click Add Widget.
.jpg)
To find relevant data, select the Calls category from the list.
.png)
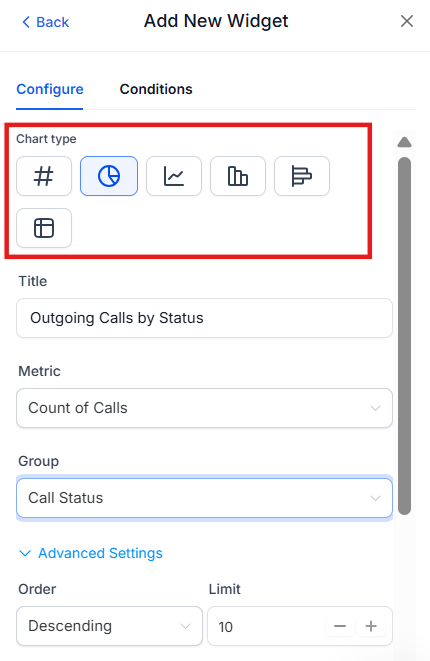
- To place a metric on your board, click on your desired call tracking widget.
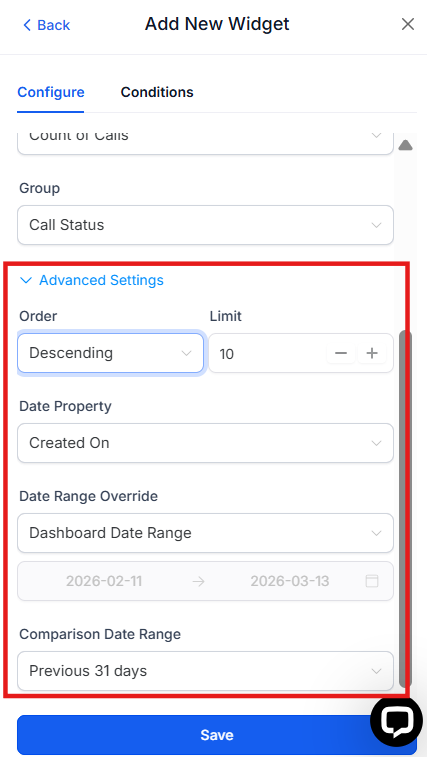
- To refine the data shown, click the Advanced Settings on the widget to configure:
- Date Ranges: Choose from presets like “Last 7 Days,” “This Month,” or a “Custom Range.”
- Chart Types: Select a Donut, Line, Bar, or Horizontal Bar chart.
- Sorting: Adjust the order and number of entries displayed.
Call Attendee Metrics
Section titled “Call Attendee Metrics”To finish, click Save on the dashboard.
Detailed Overview of Call Tracking Widgets
Section titled “Detailed Overview of Call Tracking Widgets”You can add several types of widgets to your dashboard to track specific activities:
1. Call Status Tracking
- Incoming Call Status: Displays the count of incoming calls (e.g., Answered, Missed, Busy).
- Outgoing Call Status: Displays the count of outgoing calls made by your team.
2. Duration Metrics
- Total Duration: Tracks the sum of all time spent on incoming or outgoing calls.
- Average Duration: Calculates the mean length of calls to help assess efficiency.
3. Attendee & Team Metrics
- Total Calls by Call Attendee: Shows the number of calls made or taken by specific users.
- Average Duration by Attendee: Compares how long different team members stay on the phone.
4. First-Time Call Metrics
- Track status, total duration, and average duration specifically for new callers who have never contacted your business before.
Practical Application of Call Data
Section titled “Practical Application of Call Data”- Monitor Real-Time Performance: Use status widgets to identify peak call times and ensure you have enough staff to handle the volume.
- Analyze Trends: Use date range filters to see if your call volume is growing month-over-month.
- Enhance Team Training: Review “Average Duration by Attendee” to recognize top performers or identify team members who need more support.
Question: How do I access the dashboard section?
Answer: Navigate to the Dashboard section of your account from the main navigation bar on the left side of the screen.
Question: What should I name my new dashboard?
Answer: Choose a descriptive name that reflects the data it holds, such as “Customer Support Calls” or “Weekly Sales Activity.”
Question: How do I set privacy settings for my dashboard?
Answer: During the creation process, you can toggle between “Private” (only you can see it) or “Everyone” (all users in the sub-account can see it).
Question: How do I edit my dashboard to add widgets?
Answer: Look for the Pencil Icon at the top of your dashboard. Clicking this enters “Edit Mode,” allowing you to add, move, or resize widgets.
Question: What date ranges can I choose from?
Answer: You can select Today, Yesterday, This Week, Last Week, Last 7 Days, This Month, Last Month, Quarters, Years, or a Custom Date Range.
Question: How do I know if my “Average Call Duration” is good?
Answer: It depends on your goal! For a Support Team, a shorter duration might mean they are solving problems quickly. For a Sales Team, a longer duration usually means they are building a good relationship with the lead.
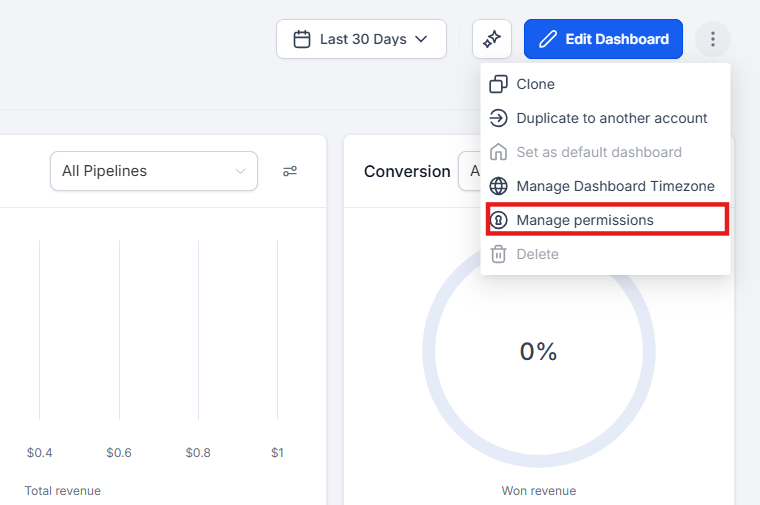
Question: Can I export the charts from my dashboard for a client report?
Answer: Yes. In “View” mode, you can click the three dots on a specific widget to Export as CSV or Download as Image. You can also use the Share Dashboard feature to send a live, view-only link.
Question: Can I duplicate a dashboard I already made?
Answer: Yes, use the Clone Existing Dashboard option when creating a new dashboard to save time on setup.
Question: What chart types are available for call widgets?
Answer: You can choose from Donut charts, Line charts, Bar charts, and Horizontal Bar charts depending on how you want to visualize the data.